The science behind Google Web Vitals metrics

Put us to the test!
Last month we reported on the Web Vitals project, with which Google means to give websites a precise reference to measure the key quality signals to ensure a good user experience. In recent days, Google has then announced that the set of metrics related to page experience will become a ranking factor in 2021, and in the meantime we can find out a little more about the reasoning that led the action of the Mountain View team and gather information about the science and studies behind the Web Vitals.
Google’s explanations on Web Vitals
The focus on this project comes from an article published on the Chromium blog and signed by three authors – Amar Sagoo, Staff Interaction Designer; Annie Sullivan, Software Engineer; Vivek Sekhar, Product Manager – who enter into the details of the initiative, designed as said to help business owners, marketing experts and developers identify opportunities to improve the user experience.
The signals derive from an extensive work by numerous researchers in the areas of human-computer interaction (HCI) and user experience (UX), but identifying the right metrics and thresholds is not as simple “as taking a research paper and find the answer”.
The user journey – and its slow downs
The googlers then begin to explain the approach used for this work, using a similitude:
Imagine you’re walking through an unfamiliar city to get to an important appointment. You walk through various streets and city centers on your way. But here and there, loose paving stones make you trip, there are slow automatic doors you have to wait for to open, and unexpected construction detours lead you astray
All of these events interrupt your progress, increase stress and distract you from reaching your destination.
Even the people who use the web are on a journey – as we said also talking about the search journey – and each of their actions is a step in what would ideally be a continuous flow. Just as in the real world, they write, ” they can be interrupted by delays, distracted from their tasks and led to make errors.”, and in turn these events can lead to a reduction in satisfaction and the abandonment of a site or the entire journey.
Which are the interruptions of the user journey
The removal of interruptions and obstacles is therefore the key to achieve a smooth journey and having a satisfied user.
The delay in loading pages
The most common type of interruption in the Web user experience is waiting for page loading.
For a developer, page loading is a discreet event and some delays may seem inevitable.
However, page loading in most cases happens in the middle of a user’s journey, while he reads the latest news facts, searches for a new product or adds items to an online shopping cart.
So, from the user’s point of view stopping to load a certain page does not represent a natural pause: he has not yet reached his goal, and therefore can be less tolerant to delays. This means that pages need to be loaded quickly so that the user journey can flow smoothly.
Assessing the speed
But how much speed does it take for the page to be fast enough? According to the Googlers, “in a way, this is the wrong question”, because there is no such thing as a single magic number (Martin Splitt already said it when talking about speed and performance) and there are three main reasons that explain it.
- First of all, the answer to the question “how fast the site must be” depends on the result we consider at that time. For instance, the abandonment, the user satisfaction or execution of tasks. “Different studies focus on different results and produce different results“.
- Secondly, the effect of delays varies enormously depending on the user’s personality, his past experience and the urgency of his task.
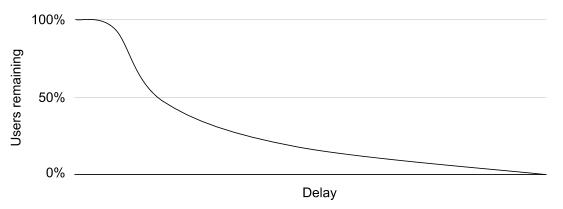
For instance, if we want to track the number of users left on a site depending on the delay they have suffered, we would not see a net shift from 100% to 0% after X seconds. On the contrary, we see a more regular distribution, like the one in the image (again from the Chromium blog), and so we have to ask ourselves: at what point in this curve do we aim? That is, how much do we invest in speed on one hand and how many of our users do we lose on the other?
- Lastly, the effect of delays varies according to context and situation. News, shopping and travel sites are often part of different types of user journeys and the entire previous curve might look different for each of them.
Even within a context, site design and user behavior can change over time.
Although this topic is more difficult than we might have hoped, a distribution of results at different performance levels still contains useful suggestions, the Googlers write. In particular, the distribution reveals how many users we could lose (really lose) due to a certain level of performance. Moreover, the slope of the curve at different points can tell us how much return we will get to optimize the speed by a certain percentage. These are important factors in our decision of compromise, because our processing time is also precious.
How to assess the site’s speed
So instead of looking for a single magic number, “our goal is to find useful ranges of values and reasonable guidelines in the search to refer to”, and the article presents at least four of them.
- A study revealed that delays reduce satisfaction and the intention to return. On unknown sites, it took 2 seconds to cause most of the fall, while familiar and already known sites collapse after longer delays. On unfamiliar sites, again, performance tasks are also compromised, with most of the decrease observed with delays of up to 4 seconds.
- Another study concerned the navigation of a nested menu on a Web page, testing for the loading of each panel a series of delays, at a distance of 3 seconds. Satisfaction decreases when you increase the delay from 0 to 3 seconds and again when you move from 9 to 12 seconds. Even the intention to return decreases when the delay is of 12 seconds. A 6-second delay was enough for some participants to define the site as slow.
- A study found that mobile Web users tend not to keep their attention on the screen for more than 4-8 seconds at a time. This means that if they divert their attention before our page is loaded, the actual viewing of the page is further delayed; for instance, a 5-second loading time could turn into an actual 10-second delay in viewing.
- Other experts suggest that the speed of a system’s response should be comparable to the delays humans experience when interacting with each other: hence the indication to provide answers within an average time period of about 1-4 seconds.
Metrics and factors to provide a fast experience
Empirical studies are based on data with high variability and gradual drop-offs rather than rigid thresholds, and others instead on theoretical predictions: collectively, they suggest that it is worth aiming to maintain loading times within a couple of seconds.
The Largest Contentful Paint (LCP) metric measures when a page-to-page navigation appears complete for a user. Based on Chrome’s analysis of today’s Web, Google recommends aiming to keep the LCP at less than 2.5 seconds for 75% of page loading, a feasible goal for most sites.
Interruptions and instability issues
Most Web pages have to load several items and these are often uploaded progressively. This technique can be positive: if some contents are displayed as soon as possible, the user can start to approach his goal without waiting for everything to be completely loaded.
However, any change in the position of the already visible elements while the others load may negatively affect the user experience in two ways:
- If an item that the user is looking at moves suddenly, it will take at least a couple of hundred milliseconds to find its new location; if it slides out of sight, it will take much longer. This kind of interruption slows down the user journey and can be very frustrating.
- Much more serious, unexpected layout changes can cause errors. If the user is trying to tap on an item that moves, they may end up touching something else that has moved to its original location.
This is because the delay in perceiving change, deciding to abandon one’s action and then doing so can make it impossible for a human being to respond appropriately. For example, this may lead a person to click on a link, an ad, or the “Buy Now” button unintentionally and significantly interrupt the initially set path.
The Cumulative Layout Shift (CLS) metric measures the frequency with which severe and unexpected layout changes occur on a page. Fewer changes mean less possibility of interruptions and errors: the advice is to point to CLSs less than 0.1 for 75% of page loading.
Distraction and low-reactivity errors
If page uploads represent the largest transitions in a user’s path – such as entering a building, going back to the initial similarity – even small steps are important.
When you’re walking, you don’t really want to be conscious of the mechanics of walking. Ideally, you actually forget that you’re walking and can focus on other things, like finding your way. But something like having a stone in your shoe will interfere with that concentration.
Similarly, we must prevent the user experience from suffering frictions in its moment-to-moment interactions with the site. And from Google come relevant insights to achieve this goal:
- A study found that a delay in visual feedback from touchscreen buttons becomes perceptible when it increases from 70ms to 100ms; when it further increased from 100ms to 150ms, people also rated the quality of the buttons significantly lower.
- An experiment has shown that, in one animation, the illusion that one event caused another begins to break when a delay of about 100 ms occurs. It has been suggested that, similarly, the illusion of direct manipulation in user interfaces will be interrupted by longer delays than this.
Just like the LCP metric, there is no “magic number” to refer to, but only markers representing distributions. Some individuals are much more sensitive than others, and shorter delays can be noticed when tactile or auditory feedback is involved.
Besides changing the way you perceive the user interface, delaying something that people expect to be almost instantaneous can lead them to make mistakes. They could repeat an action because they think it did not work – and the second action can have an undesirable effect. For example, they can double-click an “add to cart” button and not realize that they are buying two items.
The responsiveness related to these experiences is measured by the First Input Delay (FID) and Google recommends sites to keep the FID below 100 milliseconds for 75% page loading.
The impact of the Web Vitals metrics
In conclusion, the three Googlers say they have analyzed millions of impressions on the page “to understand how these metrics and thresholds influence users“. In particular, they found out that “when a site meets the above thresholds, users are 24% less likely to quit page loading and leave the page before it finishes loading”.
A specific focus was dedicated to news and shopping sites, “whose activities depend on traffic and the completion of activities”, and the numbers found are similar: 22% less abandonment for news sites and 24% less abandonment for shopping sites.
There are few interventions that “can show this level of improvement for online companies and results like these are part of why we and our ecosystem partners prioritize Web Vitals metrics,” they emphasize.
Offering users a smooth journey is one of the most effective ways to increase online traffic and Web-based activities, and Web Vitals metrics and thresholds can offer publishers, developers and business owners clear and workable ways and techniques to make their sites part of fast and uninterrupted journeys for the majority of users.