Guide to INP optimization and page interactivity

It is the latest Google’s field metric for web performance, it measures responsiveness, similarly but more accurately than First Input Delay (FID), and it is already a candidate to join the Core Web Vitals: we talk about INP, Interaction to Next Paint, which measures how fast the page responds to a user’s input, but this time we focus on tips to optimize the performance of our pages and thus exceed the optimal benchmark thresholds. In short, we’re going to find out how to take technical action to improve INP metrics and, most importantly, always deliver good performance for our users.
The importance of the INP metric
Guiding us toward achieving this goal is the article by Jeremy Wagner and Philip Walton that appeared on web.dev, who explain all the useful details about what could become one of the key metrics also in terms of SEO and positioning.
At the end of an experimental phase of work and testing that lasted over a year, in fact, the results have corroborated expectations, and INP promises to provide a much more accurate measure of a page’s responsiveness than First Input Delay, because it considers all user interactions with the page and the full latency of qualifying interactions. This is a stark difference from FID, which as the name implies measures the first interaction and only the input delay of that interaction (with measurements therefore faster, from lower thresholds), which is the reason for the “substitution” between these two metrics, announced for March 2024, which will also impact ranking, because CWVs are included within the Page Experience indicators that various Google algorithmic systems use precisely for their ranking evaluations.
It is therefore useful to start familiarizing ourselves with this metric right away, first remembering what it means and what it measures before delving into what technical interventions are needed to optimize our pages.
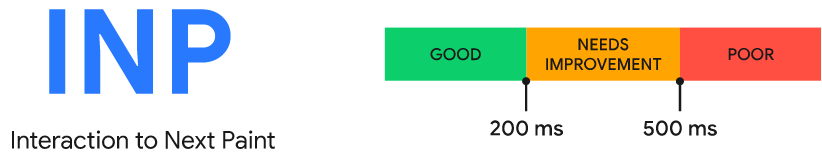
As Wagner and Walton remind us, Interaction to Next Paint (INP) is an experimental metric that assesses responsiveness, the overall responsiveness of a page to user interactions, by looking at the latency of all click, tap, or keyboard keystroke interactions that occur during a user’s visit to a page. The final INP value corresponds to the longest interaction observed, ignoring outliers: in practice, INP starts at touch and ends when the user sees something different on the screen, receiving feedback that his or her interaction triggered the change, and thus measures how quickly the page responds to a user’s input.
To provide a good user experience, sites should strive to have an Interaction to Next Paint of 200 milliseconds or less; to make sure we are meeting this goal for most of our users, a good threshold to measure is the 75th percentile of page loads, segmented between mobile and desktop devices.
Depending on the website, there may be little or no interactions – such as pages consisting mostly of text and images with few or no interactive elements. Conversely, in the case of websites such as in-browser text editors or games, interactions may be in the hundreds or even thousands. In both cases, if INP is high, the user experience is at risk.
How to optimize INP on site pages
Improving INP takes time and effort, say Googlers, but the reward is a better user experience, and there is a path to improving INP.
Before getting into the technical aspects, however, another premise is necessary: not all interactions can be attributed to a specific element, and therefore it is not always easy or possible to identify the element causing latency. This is due, the article says, to a limitation of the Event Timing API, whereby the target of an event may be absent if the element responsible for the interaction has been disconnected from the DOM or if the element is in the shadow DOM.
The first step in improving the performance of our pages is precisely to identify the cause of poor INP by trying to find out which interactions tend to be responsible for the page’s INP, in the total number of interactions users have with the page. To do this, we will start by working on data collected on the field and only then rely on lab tests to figure out what actually makes an interaction slow.
The methods for finding slow interactions in the field
And thus, data collected in the field should be the first starting point for finding slow interactions that cause poor INP.
At best, field data from a Real User Monitoring (RUM) vendor provides not only the INP value of a page, but also contextual data highlighting which specific interaction was responsible for the INP value itself, whether the interaction occurred during or after the page load, the type of interaction (click, key press, or tap), and other valuable information.
Alternatively, we can use the Chrome User Experience Report (CrUX) via PageSpeed Insights to fill in the gaps: CrUX is the official dataset of the Core Web Vitals program and provides for millions of Web sites a high-level summary of metrics, including INP. However, the web.dev article points out, CrUX often does not provide the contextual data found in providere RUMs, and so the advice is to move precisely toward such a solution or, again, implement your own RUM to supplement what is available in CrUX.
An example of analysis
The web-vitals JavaScript library is one way to find these interactions, thanks largely to its ability to attribute INP values to specific elements through its attribution build, which we see represented here in the image (which, like the others, is also from the same article).
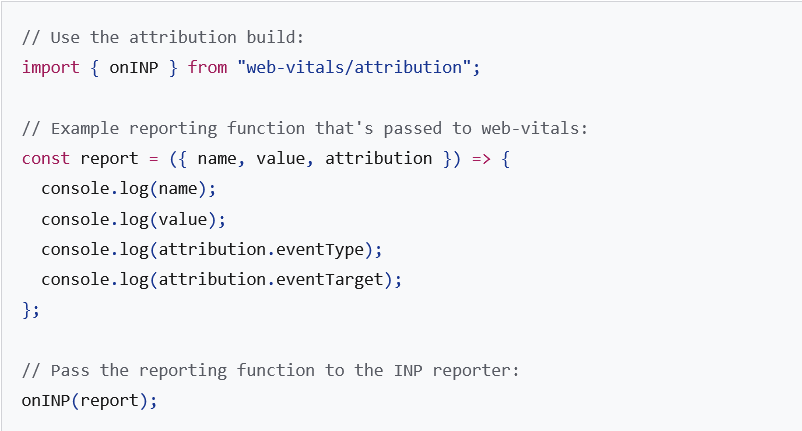
When we run this code snippet (which is a simplistic example of using the web-vitals library) and interact with a page, the console might report something like the following.
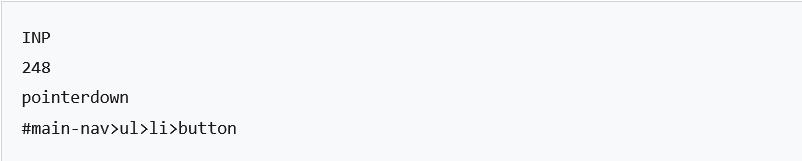
In this case, we note that the INP of the page is due to pressing a button in the navigation menu, which took 248 milliseconds. At 248 milliseconds, the INP of this page falls into the “to be improved” category.
Reproducing slow interactions in the laboratory
Once the elements responsible for slow interactions have been identified on the field, we can move on to laboratory tools to begin profiling them, using, for example, a performance profiler such as the one available among Chrome’s DevTools.
The process described by Wagner and Walton consists of six steps:
- Visit the page that hosts the interaction we wish to test.
- Open Chrome’s DevTools by pressing Cmd+Option+I (Ctrl+Alt+I on Windows and Linux).
- Go to the Performance tab of DevTools.
- Click the record button in the upper left corner of the empty performance profiler to start recording.
- Test the desired interaction on the page.
- Click the recording button again to stop recording.
When the profiler populates with values, we can begin to see the type of work needed to drive the interaction.
There are some useful clues in the profiler to identify where the interaction occurred, particularly in the interaction trace located above the main thread trace.

The figure shows an interaction profiled in Chrome’s DevTools performance profiler: the interaction trace reports a series of events that are equivalent to a click interaction, and the interaction trace entries cover all the tasks responsible for the interaction.
Again, the Googlers issue a warning: we should not assume that we are able to reproduce the exact conditions under which a high INP was reported when we try to reproduce problems found in the field with laboratory tools. There are indeed many factors that can cause device responses to be slow and it is impossible to replicate all of them; however, if some interactions are consistently slow for many users, it should be possible to reproduce these recurring problems by mimicking conditions common to those users.
How to profile the page in the absence of field data
Not everyone collects field data from their website users, although Google suggests including field data collection in our “long-term performance optimization plans” because it will make diagnosing problems much easier. In any case, you can still profile your pages and look for interactions that might be slow, so you can optimize INP.
The first step is to diagnose common user flows: for example, if we have an e-Commerce shop, some common user flows might be adding items to cart, searching for products, and checkout.
In testing these user flows in the lab, we need to follow these directions:
- Adjust the CPU to 4x or 6x speed to more closely mirror user interaction speeds on low-end devices.
- Enable mobile emulation and choose a low-end mobile device. When using mobile emulation in DevTools, the user agent string is changed to that of the emulated device, which can affect the way the page markup is served.
- If we have the opportunity, we consider purchasing a cheaper Android phone (such as a Moto E) with reduced capabilities and profile the interactions in the lab using remote debugging.
After evaluating potential user flows, we note the slowest interactions to begin to understand where to start with optimization.
Optimizing interactions
After identifying a slow interaction and reproducing it in the laboratory , the next step is to optimize these aspects. Interactions can be divided into three stages:
- The input delay, which begins when the user initiates an interaction with the page and ends when the event callbacks for the interaction begin to be executed.
- The processing time, which consists of the time it takes for event callbacks to execute until completion.
- The presentation delay, which is the time taken by the browser to present the next frame containing the visual result of the interaction.
The sum of these three phases is the total latency of the interaction. Each individual phase of an interaction contributes a certain amount of time to the total latency of the interaction, so it is important to know how to optimize each part of the interaction so that it is executed for the shortest possible time.
Diagnose and manage the long input delay
The input delay is the first phase of an interaction: it is the period of time between when the operating system receives the user’s action and the browser begins processing the first event generated by that input.
The input delay ends just as the event callbacks for the interaction begin to be executed.
Depending on other activities on the page, input delays can be considerable: this could be due to activity occurring on the main thread (probably due to loading, parsing, and compiling scripts), retrieval handling, timer functions, or even other interactions occurring in rapid succession and overlapping one another. Whatever the source of the input delay of an interaction, one would need to minimize the input delay so that interactions can start executing event callbacks as soon as possible.
Identifying input delays in Chrome’s performance profiler is done by first finding the start of an interaction in the interactions panel and then looking for the point at which the execution of event callbacks for that interaction begins.

In this image, for example, we see an input delay caused by a task launched by a timer from a third-party script, which is running while the user is attempting to interact with the page and thus prolongs the input delay. The prolongation of the input delay affects the latency of the interaction and could therefore affect the INP of the page.
We will always run into some input delay, the article says, since the operating system always takes a while to pass the input event to the browser, but we can still have some control over the length of the input delay-the key is to figure out if there is any work going on in the main thread that prevents callbacks from being executed.
The correction of long input delays
When input delays are excessively long – literally termed long input delays-they obviously worsen the user experience, and the process of correcting the problem depends on the situation we are in.
For example, if there is a resource-intensive first-party task that could affect the input delay of an interaction, the answer is fourfold:
- Work as little as possible on all code-initiated tasks.
- Break up the longest tasks.
- Use the Scheduler API to prioritize critical tasks and defer non-critical ones.
- Consider using isInputPending to check whether a user input is pending. If so, it can be passed to the main thread so that event callbacks for that input can be executed sooner than they
- otherwise would.
When it is really the third-party code that is causing problems, there are many other things to consider, such as:
- Do a complete inventory of all third-party scripts on the Web site.
- Find out if the functionality of more than one third-party script significantly overlaps with the others.
- Eliminate redundant or low-value third-party scripts.
- Keep the remaining third-party scripts so that they affect performance as little as possible.
This is especially difficult because third-party JavaScripts create their own problem in the business environment; for example, tag managers make it very easy for even non-technical employees of a company to add third-party scripts without the knowledge of the development teams.
The relationship between script evaluation and long tasks during startup
A critical aspect of interactivity in the page lifecycle is during startup: when a page loads, it will initially render, but it is important to remember that just because a page has rendered does not mean that the page has finished loading. Depending on the number of resources required by a page to become fully functional, users may attempt to interact with the page while it is still loading.
One thing that can extend the input delay of an interaction while a page is loading is script evaluation. When a JavaScript file has been retrieved from the network, the browser still has some work to do before JavaScript can be executed: this work includes parsing a script to make sure its syntax is valid, compiling it into bytecode, and finally executing it.
Depending on the size of a script, this work can introduce lengthy tasks on the main thread, which will delay the browser from responding to other user interactions. To keep the page responsive to user input while the page is loading, it is important to understand what we can do to reduce the likelihood of long activities while the page is loading so that the page remains snappy.
The work to optimize event calls
Input lag is only the first part of what INP measures, because we also need to check event callbacks that are executed in response to a user interaction, which should be completed as quickly as possible-in the image we can see, for example, event callbacks executed in response to simple a tap interaction, as shown in the Chrome DevTools performance profiler.
Delegate tasks to the main thread
Wagner and Walton write that the best advice for optimizing event callbacks is to minimize their work. However, our interaction logic may be complex, so we may only be able to marginally reduce the work they do.
If this is the case for our Web site, we can try to split the work in the event callbacks into separate tasks, so that the collective work does not become a lengthy task that blocks the main thread, and thus allow other interactions that would otherwise be waiting on the main thread to execute in advance.
setTimout a way to split tasks because the callback passed is executed in a new task: we can use setTimeout alone or abstract its use into a separate function for more ergonomic delegation. Passing tasks indiscriminately is better than not passing them at all, but there is a more nuanced way to delegate to the main thread, which involves delegating only immediately after an event callback that updates the UI, so that the rendering logic can be executed first.
Delegating to allow rendering to occur sooner
A more advanced delegation technique involves structuring code in event callbacks to limit execution to only the logic needed to apply visual updates for the next frame, deferring everything else to a later task.
This not only keeps callbacks light and agile, but also improves rendering times for interactions by not allowing visual updates to block event callback code.
For example, let’s imagine that we use an RTF text editor that formats text as we type, but also updates other aspects of the user interface in response to what we type, such as word count, spelling errors, and so on; in addition, the application may need to save what we have written, so that if we exit and re-enter, we do not lose the work we have done.
In this case, there are four things that need to happen in response to the characters typed by the user. However, only the first item needs to be executed before the next frame is presented.
- Update the text box with the characters typed by the user and apply the required formatting.
- Update the part of the user interface that displays the current word count.
- Run the logic that checks for spelling errors.
- Save the most recent changes (locally or to a remote database).
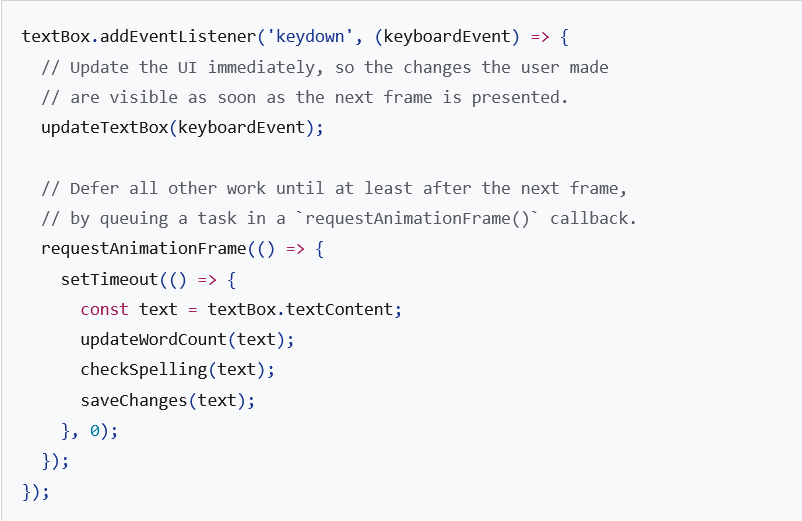
The code to do this might look like this shown in the image. The visualization below, on the other hand, explains why deferring non-critical updates after the next frame can reduce the processing time, and thus the overall latency of the interaction.
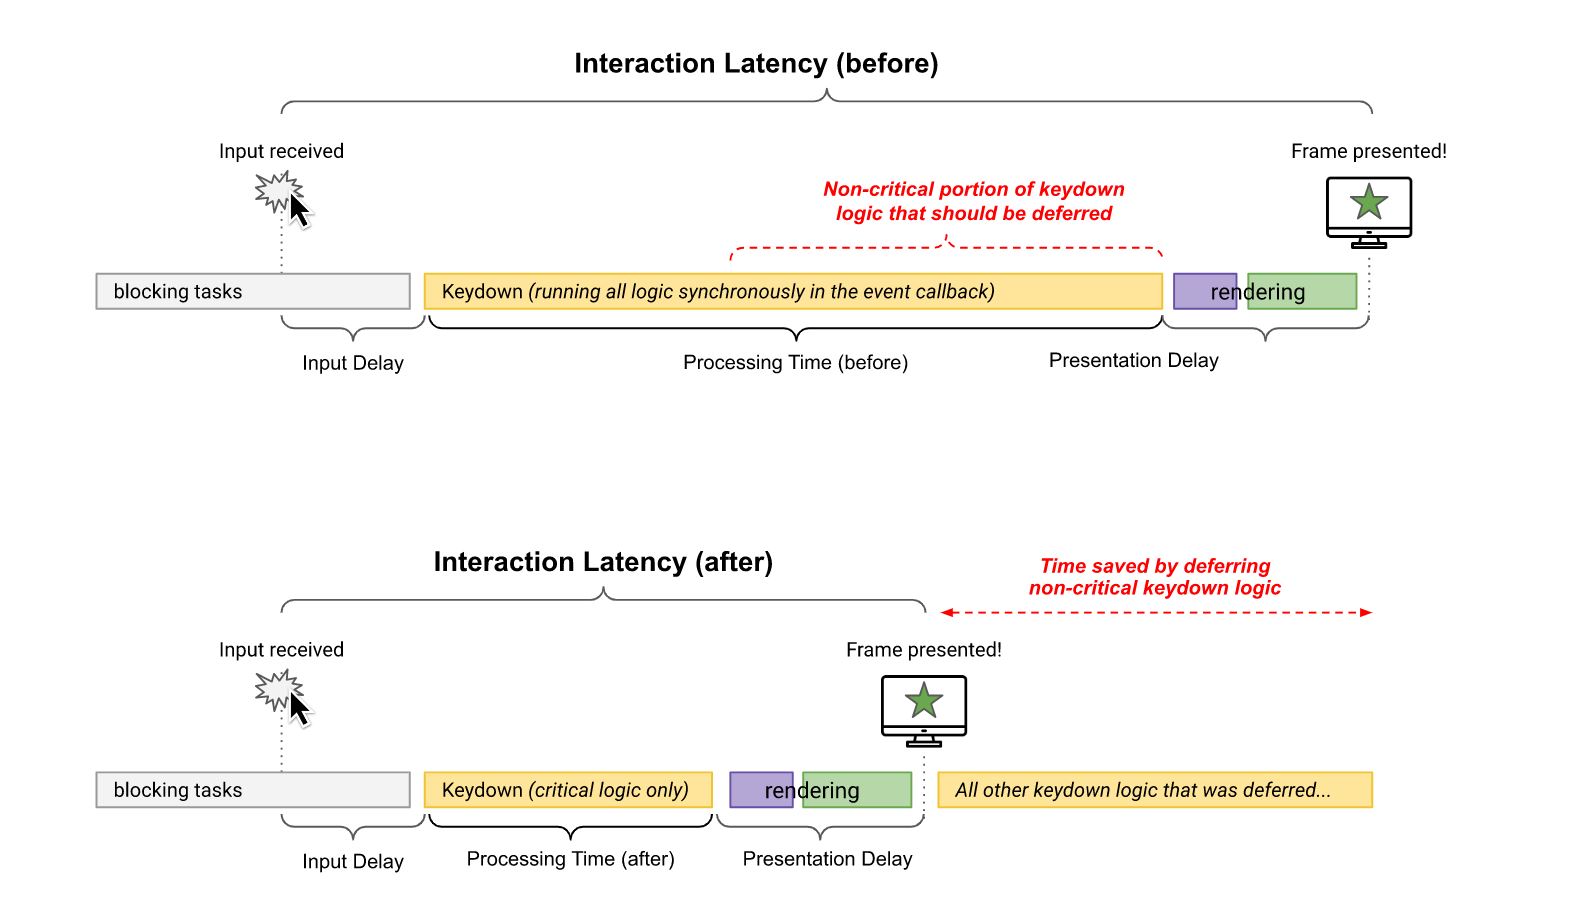
Although the use of setTimeout() within a call to requestAnimationFrame() in the previous code example is a bit esoteric, it is an effective, cross-browser way to ensure that noncritical code does not block the next frame.
Avoiding layout trashing
Layout thrashing, sometimes called forced synchronous layout, is a rendering performance problem in which layout thrashing occurs synchronously, particularly when we update styles in JavaScript and then read them in the same task, and there are many properties in JavaScript that can cause layout thrashing.

In the image above, for example, we see a case of layout thrashing as shown in the Chrome DevTools performance panel: rendering tasks involving layout thrashing are marked by a red triangle in the upper right corner of the call stack portion, often labeled **Recalculate Style** or **Layout**.
Layout thrashing is a performance bottleneck because, by updating styles and then immediately requesting the values of those styles in JavaScript, the browser is forced to perform synchronous layout work that it otherwise could have deferred and executed asynchronously later when the execution of event callbacks is complete.
Minimize presentation delay
The last phase of an interaction is the presentation delay, which begins when the event callbacks have finished executing and ends when the browser is able to present the next frame to the user’s display.
Unfortunately, presentation delays are the ones we have the least control over, but there are a few things to watch out for if we notice frames being delayed:
- Do not abuse requestAnimationFrame() for non-rendering work. The requestAnimationFrame() callbacks are executed during the rendering phase of the event loop and must be completed before the next frame can be presented. If we use requestAnimationFrame() to perform operations that do not involve UI changes, keep in mind that we may delay the next frame.
- Pay attention to async and await and our assumptions about how they work. Just because you use these functions (or Promises in general) does not mean that the work they do does not block rendering. It is entirely possible that an asynchronous function-even if it breaks the work into a callback in a separate task-could still block rendering if the browser chooses to execute it before the next frame is presented. For this reason, it is important that all tasks be short.
- Pay attention to the ResizeObserver callbacks. Such callbacks are executed before rendering and may delay the presentation of the next frame if the work in them is resource-consuming, as in the case of event callbacks: to avoid this situation, it is suggested to defer any unnecessary logic to the next frame.
Compressing the size of the DOM
When the DOM of a page is small, the rendering job usually finishes quickly, but the rendering job tends to shrink as the DOM size increases, especially when they become very large. In fact, the relationship between rendering work and DOM size is not linear, but large DOMs still require more work to render than small DOMs. A large DOM is problematic in two cases:
- During initial page rendering, where a large DOM requires a lot of work to render the initial state of the page.
- In response to a user interaction, where a large DOM can cause rendering updates to be very dispensable and thus increases the time it takes the browser to present the next frame.
There are cases in which large DOMs cannot be reduced significantly, and even standard techniques for reducing their size-such as flattening the DOM or adding to the DOM during user interactions to keep its initial size small-cannot completely solve the problem, Google developers admit.
Use content-visibility for lazy rendering of off-screen elements
One way to limit the amount of rendering work during page loading and rendering work in response to user interactions is to rely on the CSS content-visibility property, which effectively amounts to lazy rendering of elements as they approach the viewport. Although this property can take some practice to use effectively, it is worth checking to see if the result is actually a lower rendering time that can improve the INP of the page.
Performance costs in rendering HTML with JavaScript
“Where there is HTML, there is HTML parsing,” the guide says, and after the browser has finished parsing HTML into a DOM it must apply styles, perform layout calculations, and then render that layout. This is an unavoidable cost, but the way we render HTML is important.
When the server sends HTML, it arrives in the browser as a stream: this means that the HTML response from the server arrives in blocks. The browser optimizes the way it handles a stream by incrementally parsing the blocks of that stream as they arrive and displaying them bit by bit. This is performance optimization, as the browser implicitly delegates periodically and automatically as the page loads, and we get this for free.
Although the first visit to any Web site always involves some amount of HTML code, a common approach starts with an initial minimal bit of HTML code, then JavaScript is used to populate the content area. Subsequent updates to that content area also occur as a result of user interactions. This is usually called the single-page application (SPA) model, but it has a disadvantage: by rendering the HTML with JavaScript on the client, we not only get the cost of JavaScript processing to create that HTML, but also the fact that the browser will not delegate until it has finished parsing that HTML, and renders it.
It is critical to remember, however, that even Web sites that are not SPAs will likely involve some amount of HTML rendering via JavaScript as a result of the interactions. This is generally fine, as long as we are not displaying large amounts of HTML on the client, which can delay the presentation of the next frame. However, it is important to understand the performance implications of this approach to rendering HTML in the browser and how it may affect the responsiveness of our Web site to user input if we render a lot of HTML via JavaScript.
The cases of overlapping interactions
The Googlers’ article also addresses how interactions can overlap: for example, if there are many interactions in a short period, it is possible that the processing time or presentation delay of one interaction is a source of input delay for a later interaction.
This image shows us the technical visualization of the problem, with two concurrent interactions resulting from Chrome’s DevTools performance profiler: rendering work in the initial click interaction causes an input delay for the subsequent keyboard interaction.

These overlaps are difficult to diagnose on the field, in part because it is difficult to tell if the source of a high INP is due to multiple interactions interfering with each other. The best thing to do to reduce the poor responsiveness of interactions is to do as little work as possible in interaction event callbacks and always keep tasks short. This helps reduce contention between interactions and gives the main thread a little more breathing room.
INP optimization requires persistence
Improving a site’s INP is an iterative process, Jeremy Wagner and Philip Walton conclude: after solving a slow interaction in the field, it is very likely that (especially if our website offers tons of interactivity) we will begin to find other slow interactions that we similarly need to optimize.
The key to improving INP is perseverance, then. Only with the right patience will it be possible, over time, to bring the responsiveness of our page to a point where users are satisfied with the experience we offer.
It is also likely that as we develop new features for users, we will need to follow the same process of optimizing interactions specifically for them.
In short, optimizing INP will take time and effort, but it is time and effort well spent, the Googlers promise.