Google’s Core Web Vitals: key metrics for SEO and UX

Put us to the test!
How can one determine whether a user has had a pleasant or frustrating experience on a site? That’s the question the Core Web Vitals, the set of technical metrics focused on specific user experience parameters that Google has introduced to measure how well a page succeeds in providing a smooth and seamless experience, seek to answer to. First introduced in 2020 and officially included within the ranking factors that make up the Page Experience, today the Core Web Vitals consist of Largest Contentful Paint, Cumulative Layout Shift and Interaction to Next Paint and analyze content loading speed, visual stability and interactivity. So let’s get a better understanding of the nature and importance of these indicators, which have become essential for those seeking to improve the visibility and usability of their site, while also influencing (a little bit) the ranking in search results.
What Core Web Vitals are
Core Web Vitals are a group of metrics that Google considers essential for measuring the overall health of a web page.
These indicators focus on three fundamental aspects of the user experience: loading, interactivity and visual stability, which are considered key aspects of UX.
The Web Essential Signals thus introduce quantified benchmarks to assess the experience provided to the user, apply to all web pages, should be measured by all site owners, and are present in all Google tools.
Your ally to succeed on Google


Currently, there are three metrics being considered: Largest Contentful Paint (LCP), Cumulative Layout Shift (CLS), and Interaction to Next Paint. To be precise, LCP measures the time it takes to load the main content of a page, CLS quantifies the frequency and severity of unexpected page layout shifts, and finally INP measures the time between the moment a user interacts with a page and the moment the browser visually renders the change caused by that interaction.
Each of the Core Web Vitals represents a distinct aspect of user experience, is measurable in the field, and reflects the real-world experience of a critical user-centric outcome. Concretely, these metrics become key indicators by which developers and site owners can measure and optimize web page performance.
What Core Web Vitals are: the three metrics chosen by Google
The metrics that make up the Core Web Vitals evolve over time, Google specified, although there is no precise or assiduous cadence, to avoid changing the goals to be achieved by SEOs and developers too frequently.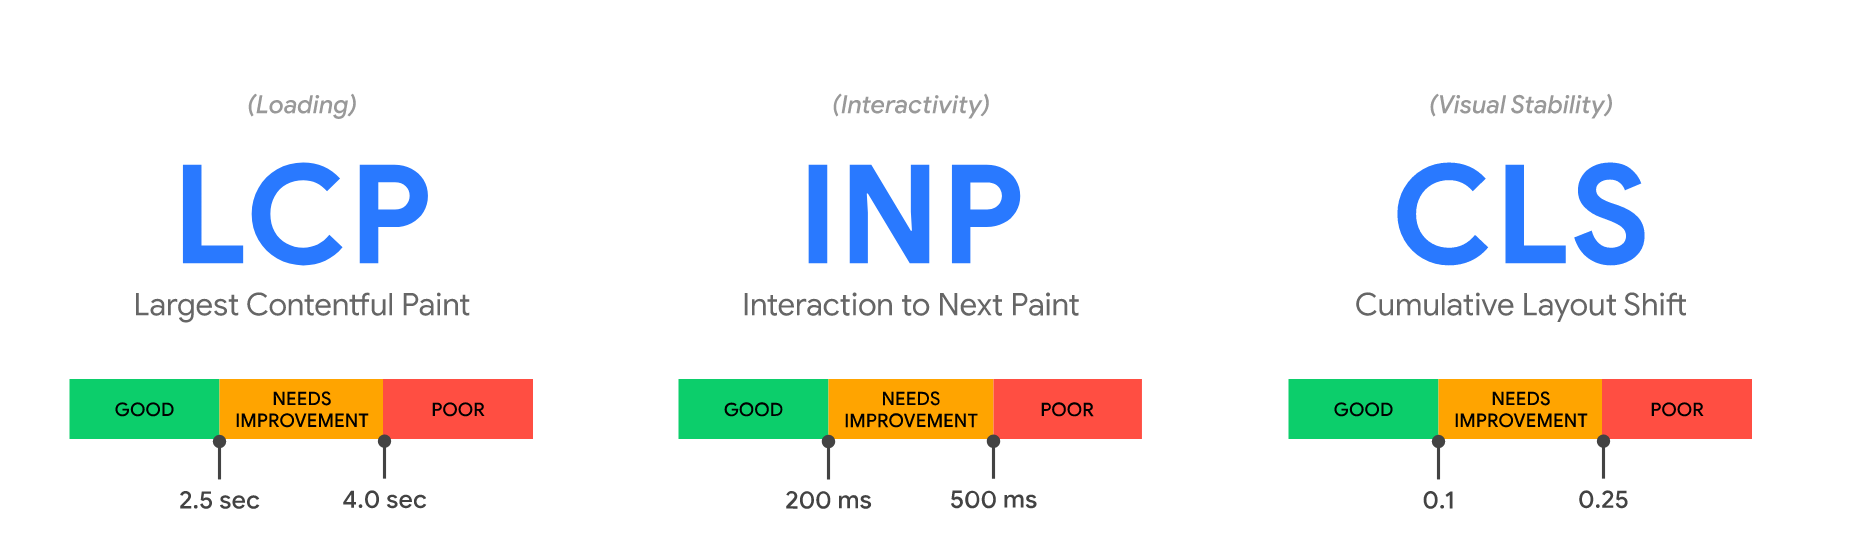
As of today, April 2024, there are three benchmark indicators and they focus on the three aspects mentioned earlier – loading, interactivity, and visual stability:
- Largest Contentful Paint (LCP). It measures loading performance. More specifically, it calculates the time interval between the start of loading a page and the complete rendering of the largest image or block of text in a user’s view. Based on Google’s studies, to provide a good user experience the LCP should occur within 2.5 seconds of the first page launch.
- Interaction to Next Paint (INP): measuresinteractivity. More precisely, it calculates the time between the moment a user interacts with a page and the moment the browser visually renders the change caused by that interaction (e.g., updating the page content). To provide a good user experience, pages must have an INP of 200 milliseconds or less.
- Cumulative Layout Shift (CLS). It measures visual stability. More specifically, it calculates the amount of unexpected movement of page elements during loading due to DOM manipulation or lack of size attributes for major media elements. Pages must maintain a CLS of less than 0.1 to provide good UX.
As per Google’s guidance, to perform satisfactorily and ensure that most people who visit the website have a positive experience we must aim for the 75th percentile for each of the three CWV metrics. Said another way, it is important that 75 percent of page loads on the website meet or exceed the recommended performance goals-measured separately for mobile and desktop devices, as user experiences may differ on different platforms.
And so in order for our site to provide what can be considered a “good” user experience, we need to verify that at least 75 percent of page loads exceed the Core Web Vitals compliance thresholds and the recommended goals for all three metrics. Google chose the 75th percentile as the benchmark because it represents a good balance between ensuring that most users have a positive experience and allowing for some variability in performance. If the target were higher, it would be too difficult for webmasters to achieve and too many websites would be noncompliant; conversely, if the target were too low, it would not ensure a good enough user experience for most users.
What Core Web Vitals are for
Google’s Core Web Vitals project was first described in May 2020 by Web Performance Engineer Ilya Grigorik on the Chromium blog, who defined it as a unified guide to quality signals that are essential to delivering a great user experience on the web.
The initiative was thus created with the express purpose of providing unified signals for the web page quality indicators that are needed for a great user experience on the Web, and to simplify the wide variety of performance measurement tools available, helping site owners focus on the metrics that matter most – the “essential” signals, in fact.
In the work of optimizing site user experience, it is not always easy to understand which aspects are important to focus on, so Google decided to fix Web Vitals to simplify the analysis by identifying the metrics that matter most in the process of working on the quality of user experience, which remains key to the long-term success of any Web site.
While measuring the quality of user experience has many facets and some aspects are site- and context-specific, Google has then identified a common set of key signals for all Web experiences. Each of these metrics represents a distinct aspect of UX, is measurable in the field, and reflects the actual experience of a critical user-centered outcome; moreover, the Core Web Vitals apply to all Web pages, must be measured by all site owners, and are displayed on all Google tools.
The relevance of the Core Web Vitals thus lies in their ability to directly influence the user experience: a site that loads quickly, responds promptly to interactions, and maintains visual stability provides a much more pleasant and frustration-free experience. This not only improves user satisfaction, but can also help improve conversion rates and reduce site abandonment rates.
What Google’s Core Web Vitals mean
Going even deeper with this set of metrics, we can better understand the Core Web Vitals if we analyze the “question” they provide answers to. Namely:
- How long does the web page take to load? The main metric for this is the Largest Contentful Paint, which measures the time it takes to load the main visible content of the page.
- How long does it take for a user to be able to interact with the web page after it has started to load? The primary metric for this is INP, which measures the time it takes for the page to respond to all the clicks, touches, and keyboard interactions that occur during a user’s visit.
- How stable is the layout of the web page as it loads? The primary metric for this is CLS, which measures the amount of unexpected movement of page elements while loading.
In particular, a good CLS (less than 2.5 seconds) ensures that users can quickly access the information they are looking for, significantly improving their experience on the site. A high CLS can cause frustration as users may unintentionally click on the wrong elements if they move unexpectedly. INP evaluates the overall adaptability of the page by measuring how long it takes to respond to user “prompts”: if the value is less than 200 milliseconds, responsiveness is considered good and can contribute to a smooth and satisfying user experience.
The other Web Vitals: all the important signals for Google
Of course, the work of optimizing UX doesn’t end with just these three indicators, and Philip Walton’s article on web.dev explains well how the Core Web Vitals are just some of the key metrics for understanding and delivering a great user experience, because there are other “vital metrics” as well.
These other Web Vitals often serve as proxy or supplemental metrics for the Core Web Vitals, and help capture a larger part of the experience or in diagnosing a specific problem. In particular, the guide cites Time to First Byte (TTFB) and First Contentful Paint (FCP) as vital aspects of the loading experience, useful in diagnosing problems with LCP such as slow server response times or resources blocking rendering.
Similarly, Total Blocking Time (TBT) is a vital lab metric that can be used to identify and diagnose potential interactivity issues that may impact INP, but it is not part of the Core Web Vitals set because it is not measurable in the field and does not reflect a user-centric outcome.
Then there is the case of First Input Delay or FID: this metric measures the time it takes for a page to be ready for user interactivity, that is, how long it takes the page, as it is assembled, to respond to clicks, scrolls, or keyboard input by processing corresponding event handlers. Until March 2024, FID was “the” CWV metric for responsiveness, but it was replaced by INP due to some known limitations-for example, FID measures only a user’s first interaction with a page, while INP takes into account all subsequent interactions. According to Google, INP overcomes some of these measurement limitations and allows developers to measure responsiveness “the way real site users experience it.”
This situation confirms to us that the Core Web Vitals, while a gold standard for website performance, are not “static” but subject to evolution to adapt to changing user expectations and technological innovations.
As Grigorik said, the current Core Web Vitals metrics measure three important aspects of user experience on the Web, but Google is aware that “there are many aspects of user experience that are not yet covered.” Hence the decision to update the Core Web Vitals on an annual basis and to provide regular updates on future candidates, motivation, and implementation status-although in fact in recent years the set changed precisely only in March 2024.
For example, Grigorik anticipated that Google was reasoning investing in “building a better understanding and ability to measure page speed and other key features of the user experience.” Specifically, the article mentioned the possibility of “extending the ability to measure input latency between all interactions, not just the first one; new metrics to measure and quantify smoothness; supporting primitives and metrics that will enable the delivery of instantaneous and privacy-preserving web experiences; and more,” but as mentioned to date only the first “promise” has materialized.
How to evaluate Core Web Vitals of site pages
To evaluate the performance of a site’s pages and see if they exceed quality thresholds, Google uses both data collected on the field (Real User Monitoring or RUM) and simulations in the lab. Field data come from the users themselves as they browse the Web and provide realistic insights into site performance in everyday usage scenarios. Lab simulations, on the other hand, allow developers to test and optimize their pages under controlled conditions before launch, but they do not provide real-world insights.
The values of the Core Web Vitals metrics
It is worth noting that these metrics focus on the completion of certain events-including what is interactively or visually affected when these events occur-as pages load to a point of stability relative to user experience, as Detlef Johnson explains on Search Engine Land.
This means that score values can change as users interact with the page, and in general we get better scores when events occur faster along stopwatch intervals.
Google suggests a method to make sure we reach the recommended goal for most of our users: for each metric, a good measurement threshold is “hitting the 75th percentile of page loads, segmented across mobile and desktop devices.”
More specifically, the performance metrics for each Web Vitals statistic are ranked according to three outcomes:
- Good (signifying promotion)
- Improvements Needed
- Failed
Longtime users of Pagespeed Insights may be familiar with similar metrics, many of which will remain unchanged, though perhaps not all. Vitals Web Cores represent the culmination of these other metrics and with them derive from the complexity of the Developer Experience, simplified to allow all users (site owners, but also webmasters and developers) to count on a welcome clarity and less metrics, but larger, to follow.
Indeed, over time, Google has developed many useful metrics and tools to help business owners, marketers, and developers identify opportunities to improve everything related to UX, including through collaboration with millions of web developers and site owners.
In addition to the aforementioned PageSpeed Insights we also remember Lighthouse, Chrome DevTools, and the Speed Report in the Search Console, which are certainly useful and valuable: however, the abundance of metrics and tools has made it challenging to keep up, understand how all the data provided works and interprets, and as a result has complicated the decision-making process on where to prioritize one’s efforts, making precisely the need for simplification and optimization.
Basically, we need to understand what the metrics and their values mean:
- LCP (Largest Contentful Paint): measures the time taken to display the largest content element in the visible area from the time the user requests the URL. This is usually an image or video or a large text element at the block level. This metric is important because it indicates how quickly a visitor sees that the URL is loading. The score may change while the page is loading and when the content is visible, but the largest node remains in the backlog yet to be viewed; this becomes more apparent on limited connection speeds.
- CLS (Cumulative Layout Shift): measures the total sum of all individual layout shift scores for each unexpected layout shift that occurs during the entire duration of the page. CLS can be determined by the absence of size definition for our hero images, for example, causing initial temporary placement of text on pages that then shifts “destructively” when loading is complete, possibly also causing unintentional user clicks or taps. The CLS score is between zero and any positive number, where zero indicates no change and the number, as it increases, indicates progressively more significant layout change on the page. This figure is important because variation in page elements while a user is trying to interact constitutes a negative user experience.
- INP (Interaction to Next Paint): this is the most recent metric and evaluates the overall adaptability of a page to user interactions by looking at the time it takes the page to respond to all clicks, touches, and keyboard interactions that occur during a user’s visit to a page. The final INP value corresponds to the longest interaction observed, ignoring outliers.
The tools to measure the Core Web Vitals
There is a variety of tools provided by Google and third parties that we can use to measure the Core Web Vitals of the site. For Google, in particular, Core Web Vitals are central to all Web experiences, and as a concrete demonstration of this focus, virtually all of its most popular tools allow us to measure Core Web Vitals.
Useful tools for measuring Core Web Vitals metrics therefore include:
- Google PageSpeed Insights. This online tool analyzes the content of a web page and generates suggestions for improving speed and the overall experience. It provides data for both mobile and desktop versions of the site. It is the first tool to use to measure Web Vitals: in the report we can get both lab and field data (if available), but also many other metrics largely related to improving pages with errors, especially results that affect the speed of a page and the downloading of its resources. In SEOZoom, for example, the Core Web Vitals section found in the Projects area reports PageSpeed Insights data for the domain we are monitoring on a project basis.
- Google Search Console. Search Console has a dedicated Core Web Vitals report that shows how pages on your site are performing, based on actual usage data collected through the Chrome User Experience Report (CrUX).
- Chrome User Experience Report. As part of its Chrome User Experience Report (CrUX), Google shows field data from more than 18 million websites that have collected enough statistics to report Web Vitals. The data are stored in Google’s BigQuery service, where queries can be made on statistics from these Web sites going back several years; updates are ongoing and available on the second Tuesday of each month, following the accumulation. CrUX data is collected from real browsers around the world based on certain browser options that determine user suitability; a set of dimensions and metrics are collected that allow owners to determine user experience on their sites.
- Chrome DevTools. The Chrome browser provides the ultimate set of tools to discover or track problems using the highly detailed information available in reports and page load records in the Performance tab. The wide range of tools, switches and endless options are ideal for more demanding optimization work that relies on real-time performance measurements of a specific page.
- Vitals Web Extension for Chrome. Using the Chrome extension, Web Vitals can be accessed directly at page load and, as mentioned, interact with the page to troubleshoot any problems. It is also available from page to page while browsing Web sites.
- WebPageTest. This independent testing tool allows you to configure the approach with a variety of conditions; built by Google engineers who are part of the Chromium team, the information is authoritative and makes the RESTful API available.
- Web Vitals JavaScript API. Allows us to use JavaScript to access metrics directly from the browser and transmit them to a repository of our choice. Alternatively, we can incorporate the test into the development process and ensure that changes made do not adversely affect the scores after pushing.
In addition, to make it easier for developers to measure the performance of these sui metrics for their sites, an open source JavaScript library dedicated to Web-vitals has also been released, which can be used with any analytics provider that supports custom metrics or, alternatively, as a reference to know how to accurately capture each of the Core Web Vitals for the users of our site.
How to measure Core Web Vitals: the quick guide to tools
It is Walton‘s guide again that takes us deeper into the use of tools for measuring and reporting on Core Web Vitals, distinguishing between those that use “field” data and those that rely on “lab” analysis.
Field tools – tools that provide actual usage data (sometimes called field data) – include Chrome User Experience Report, PageSpeed Insights, and the Search Console’s Core Web Vitals report.
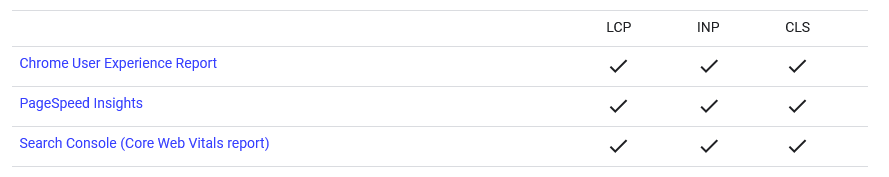
Chrome’s User Experience Report collects anonymous and true user measurement data for each of the Core Web Vitals; this data allows site owners to quickly evaluate their own performance without having to manually set up analytic data for their pages and feeds tools such as PageSpeed Insights and Search Console’s Core Web Vitals report.
There is a “downside,” however: while CrUX-provided data offers a quick way to assess site performance, it does not provide the detailed telemetry per page view that is often needed to quickly diagnose, monitor, and react to regressions accurately. As a result, Google strongly suggests that sites set up their own monitoring of real users.
Thus, one possible solution is to measure Core Web Vitals in JavaScript, using standard Web APIs to evaluate each of the three metrics.
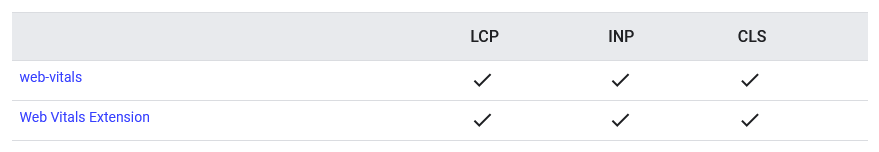
The easiest way to measure all Core Web Vitals is to use the web-vitals JavaScript library, a small, production-ready API wrapper that measures each metric to accurately match the way Google’s tools report it. That way, measuring each metric is as simple as calling a single function. After configuring the site to use the web-vitals library to measure and send Core Web Vitals data to an analytics endpoint, the next step is to aggregate and generate reports on that data to see if pages meet the recommended thresholds for at least 75 percent of page visits.
We can also create reports on each of the Core Web Vitals without writing any code using the Web Vitals extension for Chrome, which integrates the web-vitals library to measure each of these metrics and show them to users as they browse the Web. This extension can be useful for understanding the performance of our own sites, those of our competitors, and the Web in general.
Finally, the last avenue is laboratory tools: although all Core Web Vitals are, first and foremost, field metrics, many of them are also measurable in the lab. Indeed, according to Google, measurement in the lab is the best way to test feature performance during development, and it is also the best way to detect performance regressions before they occur.
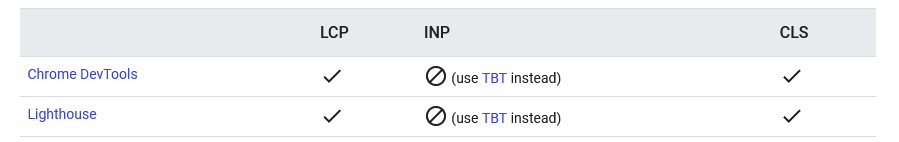
In particular, Chrome Web Tools and Lighthouse can be used to measure Core Web Vitals in a laboratory environment. Beware, however: these tools, which load pages in a simulated environment without a user, cannot measure INP because they precisely do not receive user input. However, the Total Blocking Time (TBT) metric is measurable in the lab and is an acceptable proxy for INP problems that might be due to conflicts on the main thread during startup. Performance optimizations that improve TBT in the lab should improve INP in the field.
Although measurement in the lab is an essential part of delivering extraordinary experiences, it is not a substitute for measurement in the field, Walton clarifies: a site’s performance can vary greatly based on the capabilities of the user’s device, network conditions, what other processes might be running on the device, and how they interact with the page. Indeed, the score of each of the Core Web Vitals parameters can be affected by user interaction, and only field measurement can accurately capture the full picture.
The difference between lab data and field data
In his original post, Grigorik also explained the crucial distinction between field data or field data (also often referred to as Real User Monitoring because it collects performance information recorded by users in the real world on a variety of devices and network conditions, collected anonymously) versus lab measurements.
In fact, by choice, Core Web Vitals are essentially measurable by field metrics, although lab data can also be used. Lab Data (controlled test data obtained through scientific method and objective metrics that can be calculated in a controlled environment with some level of accuracy and repeatability) remain the best way to test the performance of features during development, before they are released to users, and to detect performance regressions before they occur.
While laboratory measurements are therefore an essential part of delivering great experiences, they cannot completely replace field data, however, and Google explains why. A site’s performance can vary greatly depending on the capabilities of a user’s device, the conditions of their network, what other processes might be running on the device, and how they interact with the page.
In fact, each Core Web Vitals metrics score can be affected by user interaction, and thus only field measurement can accurately capture the full picture and provide actionable insights.
To truly understand metrics and scores, therefore, one must first familiarize oneself with the concepts of lab data and field data, or lab data and field data, a topic on which Detlef Johnson also opens a useful parenthesis.
Web Vitals’ “lab” data is collected via browser APIs as part of the page-loading event timers and mathematical approximations that simulate user interactivity. Instead, “field” data consists of the same metrics collected from actual user experiences of browsing our pages with the resulting event timer values transmitted to a repository.
Conditions of use can result in highly variable scores and the scores themselves can literally change as pages are navigated, which is why we need to understand how each score is tabulated with respect to a given environment and only truly interpret the results after first determining whether we are examining lab or field data.
How to Improve Core Web Vitals
In general, for businesses and website owners to closely monitor these metrics also means implementing the necessary changes to improve them, through actions such as optimizing images, improving JavaScript or CSS code, reducing server wait time, and other strategies.
We can then outline some quick actions to overcome the CWV thresholds of our pages.
- Optimize Loading Time (Largest Contentful Paint – LCP)
LCP measures the time it takes for the main content of a web page to load completely-it is crucial because it indicates how long a user has to wait before he or she can read or interact with the content on the page. A good LCP should occur within the first 2.5 seconds after the page is first requested. To improve this indicator we can
- Optimize images, using modern formats such as JPEG 2000, JPEG XR or WebP that offer higher quality at smaller file sizes.
- Use lazy loading and load images only when they are needed, that is, when they enter the user’s viewport.
- Minimize CSS and JavaScript, reducing file size by eliminating unused or redundant code.
- Increase interactivity (Interaction to Next Paint – INP).
INP measures the latency of all clicks, touches, and keyboard interactions with a page throughout its duration and reports the longest duration, ignoring outliers. For a good user experience, it should be less than 200 milliseconds, and to improve it we can:
- Reduce JavaScript execution, such as by breaking long tasks into shorter tasks, removing or optimizing scripts that block the main thread.
- Minimize the size of the DOM, so as to minimize the presentation delay.
- Ensure visual stability (Cumulative Layout Shift – CLS)
Cumulative Layout Shift quantifies how often visual elements shift during page loading; this phenomenon can be frustrating for users, especially if it leads to unintentional clicks. A CLS less than 0.1 is considered good and indicates optimal visual stability. For optimal CLS we can:
- Assign explicit dimensions to multimedia elements, specifying height and width for images and videos to avoid sudden shifts.
- Avoid dynamic content insertions or check that it does not cause displacement of visual elements already present.
- Pre-load critical resources
Using the pre-load feature for critical resources can significantly improve loading times. This approach allows the browser to start downloading important resources before they are actually requested, thus reducing the waiting time for the user.
- Optimize hosting and CDN
Server speed and geographic proximity to the end user can greatly influence page load time. Choosing fast and reliable hosting, along with using a CDN, can significantly decrease server response time, thereby improving LCP and other metrics.
- Enable text compression
Enabling compression of text files (such as HTML, CSS and JavaScript) via formats such as Gzip or Brotli can dramatically reduce the size of transfers, speeding up page load times.
- Use browser caching
Properly setting up browser caching for static resources (such as CSS, JavaScript, and images) allows recurring website visitors to load pages faster, reducing the number of requests to the server.
Core Web Vitals and SEO: why pay attention to them
Core Web Vitals are more than just a set of metrics, because they are the manifesto of a web that puts the user first, and they represent both a challenge and an opportunity for everyone operating online.
This also applies to the SEO aspect, as Google continues to emphasize the importance of site usability in its ranking algorithms, and has officially introduced CWVs among the signals used by several of its ranking systems. More specifically, Core Web Vitals are included in the larger complex of Page Experience, a set of factors that quantify and qualify the experience a site gives its users. And although the direct effects on ranking are “mild,” as we shall see, it is still one of the many aspects to consider when building a site that aspires to have organic visibility.
Specifically, as of June 2021 Google also uses to determine and evaluate the overall experience of a page:
- Core Web Vitals. The three key metrics for evaluating performance, which measure the visual loading, interactivity and visual stability of a page as it loads for users.
- Mobile compatibility. The ability of a site to be mobile friendly, and thus its ease of use and navigation on mobile devices, including the readability of content and whether links and page elements are clickable and accessible.
- HTTPS. Focuses on whether a Web site’s connection is secure and whether or not the site is served, or not, via the recommended HTTPS protocol.
- Non-intrusive interstitials. Ensures that crucial page content is not obstructed for users while browsing by annoying interstitials.
Why are Core Web Vitals important?
We should understand what CWVs mean in practice for a site: a kind of thermometer of the user experience we are able to deliver. A good score in CWVs means that a site is fast loading, responsive to interactions, and visually stable, three factors that help reduce page abandonment rates and improve user satisfaction, among other things, and that translate not only into a competitive advantage in terms of SEO, but also into concrete benefits in terms of conversions and visitor retention.
In addition, optimizing the site for Core Web Vitals means adopting web development best practices, which has a positive impact on the scalability and management of the site itself.
First, improving Core Web Vitals means ensuring that site content is quickly accessible to users: as we know, attention is a valuable commodity, and loading speed can determine whether a visitor stays or leaves the site. A short LCP ensures that the main element of the page is visible within 2.5 seconds of initial loading, reducing the abandonment rate and increasing the likelihood of user engagement.
Interactivity, measured through INP, is equally crucial: a site responsive to user input within 200 milliseconds provides a feeling of immediacy and fluidity, key elements of a good user experience. This not only improves user satisfaction but also signals to search engines that the site is technically reliable and well constructed.
Finally, visual stability of content during loading, indicated by the CLS, avoids frustration due to unexpected movement of elements on the page: optimizing this aspect means preventing accidental user actions, such as clicks on links or buttons that suddenly move.
The challenge for developers and website owners is therefore to balance design, functionality and performance, perhaps forgoing some “frills” or JavaScript functionality to move in the direction of efficiency.
Optimizing metrics and performance: the benefits according to Google
Let us delve further into these purely technical issues to understand even more clearly why it is important to work on optimizing these aspects on our pages. Talking about performance, in fact, means above all taking into account the concrete effects on navigation and user satisfaction, and there are many studies that relate the “time” element to returns.
And so, based on the assumption that in the Web every second counts and improves the chances of potential earnings, there are some valid reasons why SEOs and digital marketers should engage in improving (and maintaining!) the performance of site pages, focusing at least on those most important for business.
Precisely the business aspect should be a lever that drives optimization, because now more than ever the customer experience is increasingly digital and most customer journeys have digital components, even for offline purchases. Recent statistics explain that 85 percent of customer journeys go through Google Search at least once, so visibility in this area drives engagement and results.
Focusing on Google Core Web Vitals, then, means building pages that can satisfy users, even more than pages that can rank better on Google (an element that, as mentioned, has actually fallen short of expectations), and this goes in the direction of an overall improvement of the service offered that has concrete results in returns. It should not be forgotten, for example, that two separate surveys conducted by Akamai and Deloitte concluded that a 1-second delay in a page’s load time reduces conversions by a drastic 7%-9%. Loading time is a major contributor to page abandonment, and the average user has no patience to wait for a page that takes too long to load — which is precisely why Google is pushing Core Web Vitals as a ranking factor.
Creating a seamless, delay-free Web page user experience is critical to winning and keeping customers coming back, and to increasing the likelihood that potential customers will visit our Web site. Retaining users is also critical to improving conversions, while (as you might guess) slow sites have a negative impact on revenue.
According to Google’s Chromium team, implementing Core Web Vitals ensures 24 percent fewer page abandonments due to loading delays and 24 percent fewer abandonments for shopping sites. Furthermore, in a ThinkwithGoogle experience survey, it showed that just by providing a positive user experience, 67% more customers are likely to buy and 74% more likely to return to the website.
Again taking some data released by Google as a reference, page performance and improving Core Web Vitals has a direct impact on user engagement and business metrics. For example:
- Research has shown that when a site meets Core Web Vitals thresholds, there is a 24 percent lower chance that users will abandon the page while it is loading.
- With each 100 ms reduction in the Largest Contentful Paint (LCP) metric, Farfetch’s web conversion rate increased by 1.3%.
- Reducing the Cumulative Layout Shift (CLS) metric by 0.2 resulted in a 15% increase in page views per session for Yahoo! JAPAN, a 13% longer session duration, and a 1.72 percentage point decrease in bounce rate.
- Netzwelt improved Core Web Vitals metrics and reported an 18% increase in ad revenue and 27% increase in page views.
- Reducing CLS from 1.65 to 0 resulted in a significant increase in global domain rankings for redBus.
The work on Core Web Vitals and Page Speed Update
It may be worthwhile to provide even more site optimization tips to make our site “Core Web Vitals-proof,” following in particular an in-depth study in Search Engine Journal (from which the following images are taken) by Rachel Costello, who identifies seven aspects of the page experience for the user on which to focus our attentions, such as ways to ensure faster and smoother visual loading, improve mobile usability, and provide greater site security.
According to the expert, there are 7 interventions to optimize the site for Page Experience that can yield positive effects in both the short and long term as they help ensure that our users have quality experiences on our pages. Although these insights are dated (they still carry FID as a reference), they still represent valuable guidance-and indeed FID’s optimization interventions can also serve to improve INP.
Indeed, this work is not just about meeting certain criteria for search engines, but about trying to provide the best possible experiences for real users, which should be a top goal for any site.
- Preloading key resources to speed up visual loading times
One of the first indicators to a user that a page is loading is the appearance of above-the-fold content. This is where the Largest Contentful Paint (LCP) comes in, the first Core Web Vitals metric to measure how fast the main element on the page is loading.
To identify what the LCP element on a page is, simply inspect the page in Chrome DevTools and view the waterfall graph in the Performance tab. After identifying the element, the same tool provides an easy way to display the visual progress of the loading speed by profiling the page in the process and providing a screenshot of how it loads over time.
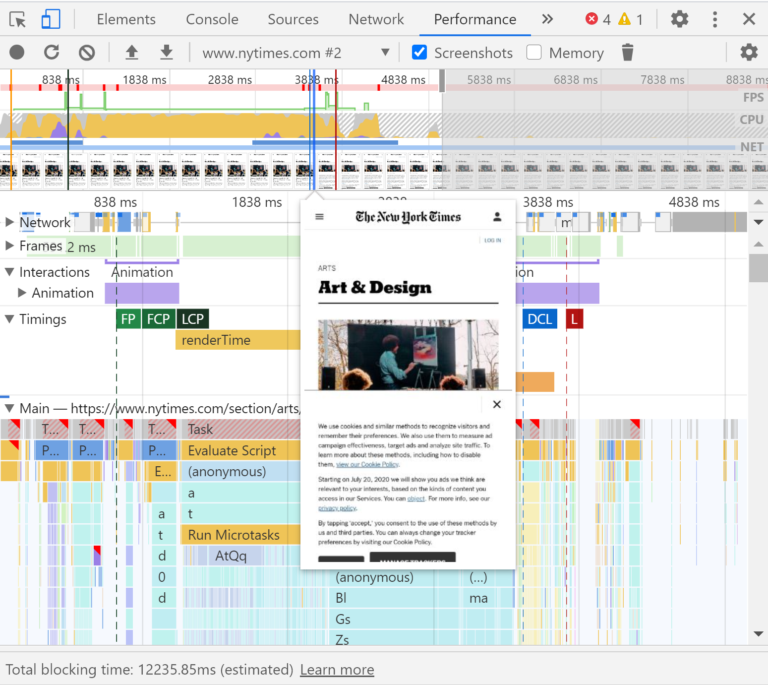
This will help us find out the loading speed of different elements on the page.
To speed up the loading of the LCP element and above-the-fold content, Costello suggests considering using methods such as preloading to tell the browser to fetch these resources first as a priority.
- Optimizing the main thread activity by minimizing long tasks
There are many different problems behind the scenes that can cause a user to have to wait for the browser to respond after clicking or tapping on a page-this is what is measured by the second Core Web Vitals metric, First Input Delay (FID).
This is an experience that can be frustrating for users, but there are things we can do to solve the problem and reduce the wait time between human interactions and browser responses.
Long tasks are one of the most common “culprits” of this problem: essentially, they are pieces of JavaScript code that block the main thread for a long period of time and cause the page to hang and not respond.
Long tasks in Chrome DevTools are located at the top of the waterfall graph in the Main tab and are highlighted with a red triangle; by clicking on a long task and going to the Bottom-Up tab, we will see broken down the different tasks that occurred within the task, such as compiling and parsing scripts.
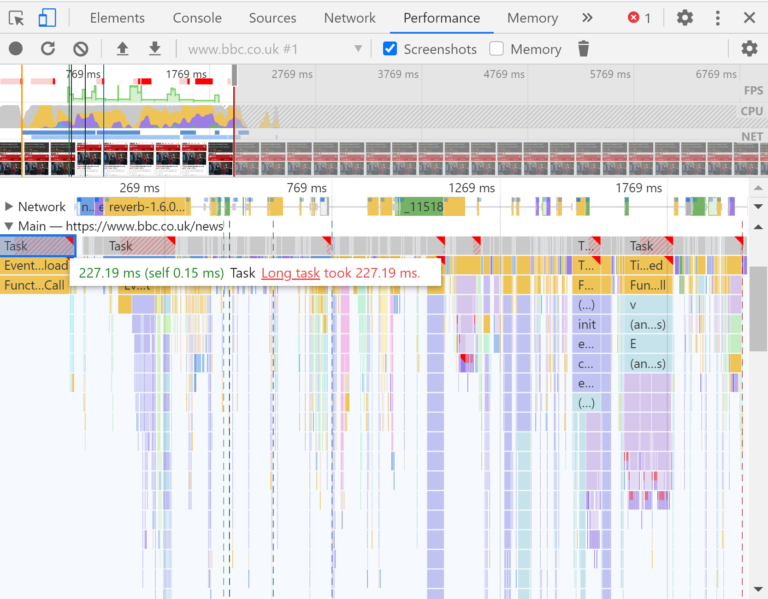
The required fix will vary depending on the tasks contributing to the main thread blocks, but a common solution for solving long tasks is to split code and process scripts into smaller blocks.
- Reserve space for uploading images and embeds
The third Core Web Vitals metric, Cumulative Layout Shift (CLS), examines the amount of visual layout shift of a page as it loads and measures a frustrating aspect of UX that we’ve probably all experienced: we intend to click on a particular link, but the page shifts and we end up accidentally clicking on a different area of the page.
One of the most common causes of a high CLS score, and thus poor UX, is not reserving space for loading images and embedded resources.
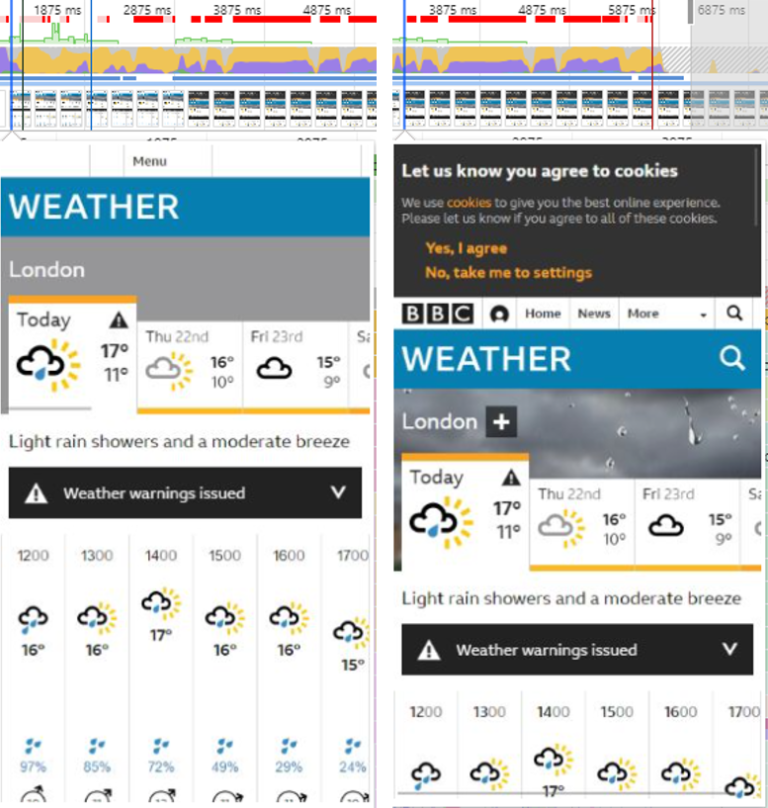
In the example provided by the article, Chrome DevTools’ screenshot function in the Performance tab shows “that the BBC Weather cookie consent banner has no space allocated for loading”; therefore, once it loads, it “pushes the visible content further down in the viewport around the 3-second mark.” Instead, space must be provided in the page structure so that its layout remains unchanged even after the resource has finished loading.
- Verify that key page templates are mobile-friendly
Since mobile traffic surpassed desktop volume in 2016, it became critical to ensure that websites were optimized for the mobile devices with which an increasing number of users were actually browsing.
The layout and usability of a website on a mobile device can decide the fate of the user experience: for example, Costello says, “users should be able to see important content clearly and accessibly, without having to zoom in.”

There are two main ways to evaluate website usability on mobile devices: the first is to monitor the Mobile Usability report in Google Search Console (which will flag problems such as content that does not fit the screen and text that is too small, as well as show us a list of affected URLs for each problem) and run key page templates in Google’s mobile optimization test, which is a good way to check individual pages.
- Do audits for site security
In addition to loading performance and usability on mobile devices, site security also plays a role in determining the page experience.
Google pushes to “make sure websites presented in SERPs are safe for users to browse, without the risk of security issues” such as malware, unwanted software, phishing and deceptive content.
An easy way to check if our site has problems that could put users at risk is the Security Issues report in Google Search Console.
- Verify that forms and embedded resources are served via HTTPS
Embedding HTTPS as a page experience signal is another way Google is trying to ensure user safety while browsing.
Publishing content that requires user interaction and input over an insecure HTTP connection poses a risk to users and makes them (and their data) more vulnerable.
This is especially worth remembering for forms where users enter personal information, such as checkouts where payment information is shared.
Performing an SEO audit for security allows us to check for these issues, and there is also a specific tool in SEOZoom to find out if the site has “mixed content,” which is mixed content with a combination of page resources served over both HTTP and HTTPS.
- Check that interstitials are not obstructing crucial content
If a site has intrusive interstitials that take up a lot of space on a page and make it difficult for users to access important content, this can create negative and frustrating experiences.

An example of an intrusive interstitial on the left, next to a non-intrusive pop-up on the right
Manually examining pages on different devices or still using the screenshot feature of Chrome DevTools allows us to visualize how interstitials might impact our users.
Our goal must be to avoid disrupting users’ browsing experiences: we can consider redesigning popups and interstitials so that they do not obstruct important content on the page, as well as take action to allow people to avoid having to manually close these ads in order to continue their journey on the site.
How much Core Web Vitals really weigh: sites that exceed thresholds and SEO effects
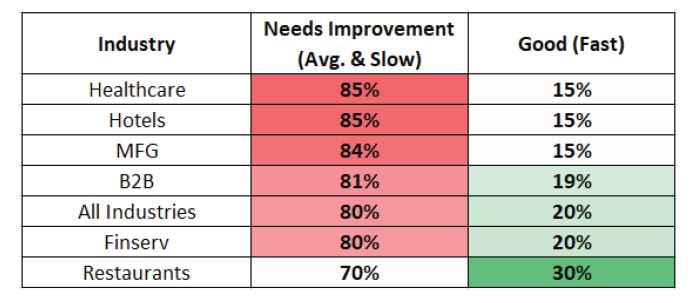
As anticipated earlier, despite Google’s bombastic statements and emphasis on this change, the concrete effects on the Web have been insignificant. For example, a November 2020 U.S. survey (about 6 months after the introduction of CWVs) revealed that less than 15 percent of the sample analyzed met the benchmarks and exceeded the metrics on the experience provided to users.
Thus, the adjustment of sites to the Core Web Vitals metrics has been slow, with the most critical areas appearing to be LCP and CLS, and then speed and layout stability. For SEO, however, there are other aspects to evaluate as well: even “if your site does not meet the Web Vitals benchmarks today, that does not mean it won’t rank at all,” pointed out an article by Matt Southern in Search Engine Journal, because “Search is complex, and Core Web Vitals are only three of many factors Google considers when ranking pages.”
What remains a priority even today is content, its quality and relevance to the query and search intent, because “a more relevant page will usually win out over a page that is faster, but with less relevant content,” Southern noted.
Analyzing the study, the expert explained that “a decidedly small percentage of Web sites are able to pass a Core Web Vitals assessment within PageSpeed Insights.” To be precise, looking overall at the benchmarks given by Google only “12 percent of the results on mobile devices and 13 percent on desktops passed the assessment,” although the sites’ performance is somewhat better “when it comes to meeting the benchmarks for a single factor”: for First Input Delay “99 percent of desktop URLs and 89 percent of mobile URLs meet the 100 millisecond benchmark,” and this “is a good sign for users, as it means they will be able to interact immediately with almost every page they arrive on.”
More problematic are the other two benchmarks: for the Largest Contentful Paint “43 percent of mobile URLs and 44 percent of desktop URLs pass the assessment” and thus load the main content in less than 2.5 seconds. For the Cumulative Layout Shift exceed the 0.1 rating “46% of mobile URLs and 47% of desktop URLs.”
This means, then, that “most pages that users land on take longer than 2.5 seconds to load and show unexpected layout changes,” thus providing a suboptimal experience for people, who have to “wait for a page to load while content swings up and down the screen.”
Core Web Vitals: still in 2022 only 1 in 5 sites cross all thresholds
Confirming that what was supposed to be an “algorithmic revolution”-an update that would upend rankings and measure, for the first time data in hand, the true performance of sites by making them ranking factors-has had less of a bombastic impact than expected is also Milestone Research’s subsequent update of its analysis of Core Web Vitals, which in August 2022 took stock of the actual rate at which sites are exceeding benchmarks.
The finding that immediately emerges is that only 20 percent of sites exceed the minimum thresholds set by Google and ensure a great user experience according to quality criteria based on precise measurement of essential aspects of a site’s technical performance.
In fact, most sites do not seem to be working with much priority on improving these metrics, and according to Milestone there has been no major improvement in the industries surveyed, leading to the (rather discouraging) figure that as of June 2022 only 19 percent of the sites studied are truly ready for all three CWVs.
Put another way: only one out of every five sites surveyed by the research exceeds the thresholds set by Google for the three metrics that make up Web Essential Signals, namely Largest Contentful Paint (LCP), First Input Delay (FID) and Cumulative Layout Shift (CLS), which respectively examine and measure page responses with respect to loading speed, interactivity and visual stability.
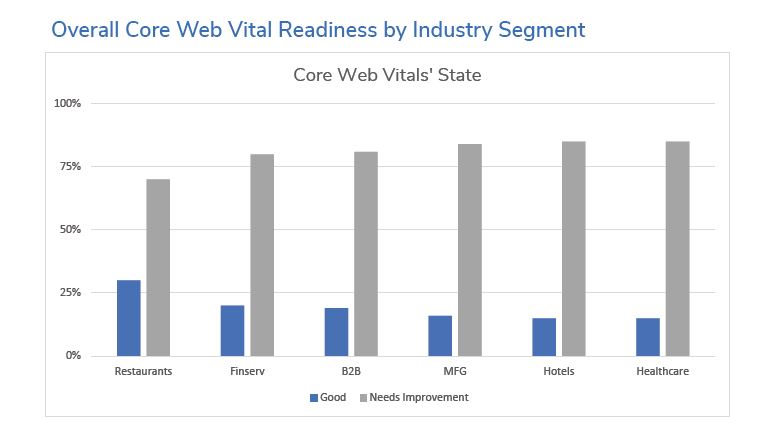
To take stock of the effective application of CWVs, Milestone Inc. crawled about 1,000 sites and 331,000 pages of active sites in industries such as financial services, B2B companies, healthcare, hotels, restaurants, and manufacturing several times, collecting data on the performance of all site pages.
The average was calculated and measured against the recommended performance standard for LCP, FID, and CLS, and sites were graded into Fast, Average, and Slow in each of the three metrics; the aggregate results were then averaged to obtain an overall grading, with possible ratings of Good, Needs Improvement, or Below Target.
On a general level, the U.S. experts were quite surprised to find that the share of fully satisfied Core Vitals sites had actually decreased since the October 2021 analysis done on the same sample of websites, meaning that in just over six months, some sites that met the standard are no longer compliant with the Core Web Vitals, a sign of a lack of ongoing measurement and maintenance of those sites.
However, there has been significant improvement for most websites in the First Contentful Paint (which, however, is not among the CVWs).


Manage all SEO aspects
Factors that most frequently cause problems with performance include: new, non-optimized content added to the website, such as images and videos; third-party javascript and tracking pixels; pop-up messages or animations that create shifts; or back-end processes, such as personalization, that reduce loading speed.
Specifically, the report reveals that 62 percent of sites experienced good or minimal cumulative content layout shifts on 90 percent or more of their pages, down 5 points from October 2021; upon closer examination, many of these sites appear to benefit from simple designs that use static images and no videos or popups.
First Contentful Paint and Largest Contentful Paint are the metrics where the examination found the most significant improvements: less than 1% of sites load all primary content in less than 1 second, and only 41% started loading FCP on 75% of pages in less than 1 second; compared to LCP, however, 28% of sites loaded content in less than 2.5 seconds.
Finally, things are a little better with respect to page interactivity, as 98% of sites recorded an acceptable First Input Delay of less than 0.1 second.
Core Web Vitals, a faded ranking factor
An analysis of the concrete spread of Core Web Vitals also came from Advancedwebranking, which performed a study of a much larger sample of sites than before (3 million web pages from Google’s top 20 search results) to also see how much page performance affects ranking in Google’s organic search and which of the Core Web Vitals metrics is most correlated with a first-page ranking.
In short, the report compiled in 2022 noted that:
- The higher the ranking on Google, the lower the LCP metric.
- Only 39 percent of the web pages analyzed exceeded the Core Web Vitals metrics, while the remaining 61 percent were below the threshold.
- 80% of pages that pass Core Web Vitals on desktop also pass them on mobile devices .
- Core Web Vitals are a ranking factor, but not as important as links, content, or search intent.

Bearing in mind that, as is often the case with considerations involving SEO, it is not possible to correlate certain factors with actual Google rankings and “correlation does not mean causation” (i.e., just because two things are correlated does not necessarily mean that one causes the other), there are nonetheless a few things to dwell on.
Regarding LCP – which, to ensure a good user experience, should occur within 2.5 seconds of the start of page loading – none of the 3 million pages sampled had an average LCP of less than 2.5 seconds, but (interesting fact) the graphs for mobile and desktop clearly show that “the higher the ranking on Google, the lower the LCP metric.”


It gets better, again, by analyzing the FID (where the good is 100 milliseconds or less), because all pages tested succeed; however, experts note, the difference in FID values among the top 20 positions is not that great, and there is no clear correlation between FID and ranking.


It is difficult to assess the effects on CLS ranking (which must be 0.1 or lower for a good user experience), because there seems to be a slight visual trend showing that rankings in the top positions have lower CLS, but the difference between CLS values is not so great as to warrant a clear correlation.


Ultimately, according to Advancedwebranking’s study, Core Web Vitals are not a key ranking factor on Google, but they can become important when competing pages in Search score well on all other relevant factors.
Picking up on some of John Mueller’s remarks, then, experts explain that CWVs are still more than a tie-breaker factor (an element that breaks the equilibrium all things being equal) and that they also serve to assess whether there are possible obstacles in the user journey, because they consider the usability of your site after it ranks (when people actually visit it): if we get more traffic through SEO efforts but the conversion rate is low, that traffic will not be as useful as it could be. Usually, it’s really elements of user experience or speed that affect conversion rate, and so analyzing CWVs and correcting problem areas “is a great way to recognize and quantify common user annoyances.”